Why Photodiode Linearity Matters More Than You Think in Your Setup
Ever stared at your measurement readings and wondered why they start looking wonky when the light gets too bright or fades out? Yeah, that’s the sneaky side of photodiode linearity creeping in. In stuff like analysis instruments or power meters, where you’re chasing pinpoint precision, this isn’t just some tech buzzword—it’s the make-or-break for trusting your data. We’re talking about how your photodiode keeps its cool and spits out steady signals no matter the light intensity. Mess it up, and your dynamic range shrinks, measurement accuracy tanks, and suddenly you’re second-guessing every test.
At Bee Photon, we’ve tinkered with this hands-on for years, hooking up PIN de Si para fotometría de precisión in labs that demand zero drama from their detectors. These little guys are built for exactly that—holding steady through wild light swings so your readings stay true. But let’s not jump ahead. Stick with me, and I’ll walk you through what this all means, why it hits your wallet if ignored, and how to nail it without the headache.
Breaking Down Photodiode Linearity: No Jargon, Just the Real Deal
Picture this: your photodiode’s like a buddy who’s supposed to react the same way to a whisper or a shout. Photodiode linearity is basically that reliability—how straight-line its output current tracks with incoming light power. If it’s linear, double the light, double the signal. Simple, right? But real life? Not so much. Things like saturation kick in at high powers, or noise muddies low-end stuff, curving that line and messing with measurement accuracy.
From what we’ve seen—and trust me, we’ve calibrated enough of these to spot patterns—linearity holds up best in the sweet spot, say 10% to 90% of max power. Outside that? Errors pile up fast. NIST folks dug into this back in 2018 with their work on optimizing linearity in high-speed photodiodes . They found that tweaking the diode’s structure, like beefing up the absorption layer, can push linearity errors down to under 1% even at gigahertz speeds. That’s huge for precision measurement where you’re not just guessing—you need data you can bank on.
Dynamic range ties right in here. It’s the span from your weakest detectable signal to the strongest before it clips. Think of it as the volume knob on your detector: too narrow, and you’re missing the highs and lows. A solid dynamic range might hit 60-80 dB in good Si PINs, but linearity is the glue keeping it honest. Without it, that range feels fake—your accuracy dips because the response warps.
We’ve got a quick table to show how this plays out in common setups. Pulled from real-world tweaks we’ve done, inspired by Gigahertz-Optik’s take on detector limits , where they note linearity only shines in a tight input band.
| Light Intensity Level | Typical Linearity Error (%) | Impact on Measurement Accuracy | Dynamic Range Example (dB) |
|---|---|---|---|
| Low (e.g., 1-10 µW/cm²) | <0.5% | Minimal noise floor interference; great for faint signals | Up to 70 dB start |
| Medium (10-100 µW/cm²) | 0.5-2% | Steady tracking; ideal for most lab work | Full 60-80 dB window |
| High (100+ µW/cm²) | 2-5%+ | Saturation risk; needs bias tweaks | Drops to 50 dB if unchecked |
See? At medium levels, you’re golden for dynamic range without sacrificing accuracy. But push high, and without smart design—like what goes into our Si PINs—you’re fighting uphill.
How Dynamic Range Ties Into Your Everyday Precision Measurements
Alright, let’s get chatty about dynamic range because it’s the unsung hero in your toolkit. In analysis gear or power meters, you’re often dealing with light that jumps from dim glows to bright blasts. Dynamic range is what lets your photodiode handle that rollercoaster without flipping out. It’s measured in decibels, and for precision stuff, you’re aiming for at least 60 dB to cover real scenarios without constant recalibrations.
Take InGaAs photodiodes—NIST ran tests showing their linearity holds tight across wavelengths, but dynamic range varies with bias voltage . Bump the voltage right, and you stretch that range by 10-15 dB, cutting distortion. We’ve mirrored that in our own benches: one client in optical comms testing saw their signal-to-noise jump 20% just by dialing in better linearity matching.
But here’s the kicker—poor dynamic range isn’t just numbers. It bites into measurement accuracy directly. Say you’re metering laser power for medical devices. A 5% linearity slip at peak could skew your calibration by watts, leading to faulty specs or worse, recalls. We’ve dodged that bullet for folks by swapping in detectors tuned for wide range, like our PIN de Si para fotometría de precisión, which clocks in at over 70 dB without breaking a sweat.
Want a peek at factors eating your range? Heat’s a biggie—temps over 50°C can halve your linear span. Or wavelength mismatches; Si shines at visible but wobbles in NIR. Thorlabs backs this with their NIST-traceable calibrations, where Si diodes show <1% deviation in traceable setups . Pro tip from the trenches: always pair with temp controls. We’ve retrofitted systems where ignoring that cost hours of debugging.
Real-World Wins: Stories from the Field on Photodiode Linearity
No fluff here—just stuff that’s worked. Take this one setup we helped with, anonymized of course. A team building spectrometry rigs for environmental monitoring was pulling their hair out over erratic low-light reads. Their old photodiodes had a measly 50 dB dynamic range, and linearity? Forget it—errors hit 3% below 5 µW. We suggested dialing in a custom bias circuit, drawing from NIST’s high-power handling tricks , and integrated something akin to our Si PIN lineup.
Result? Measurement accuracy leaped to 0.2% consistency, dynamic range pushed to 75 dB. They caught pollutants at ppb levels they missed before, all without fancy overhauls. Another time, in power meter dev for solar testing, high-intensity spikes were compressing signals. Linearity was the culprit, per IEEE insights on RF-linearized detectors hitting 100 dB DR . We looped in low-noise amps and voila—stable outputs through noon sun blasts, saving them redesign bucks.
These aren’t outliers. In precision photometry, where every photon counts, nailing photodiode linearity means fewer false alarms and tighter data. Our PIN de Si para fotometría de precisión draws from exactly these lessons: axial response uniformity under 2%, responsivity flat across 400-1100 nm. It’s not magic—it’s engineering that listens to what users like you actually need.

Fotodiodo PIN de Si con baja corriente oscura (350-1060nm) PDCC14-001
Nuestro PIN de Si para fotometría de precisión ofrece una exactitud excepcional para la medición de luz sensible. Con baja corriente oscura, este fotodiodo es ideal para instrumentos analíticos y científicos que requieren resultados precisos.
Tips to Squeeze More from Your Photodiode’s Dynamic Range
Let’s roll up sleeves on fixes. First off, bias voltage is your best friend. Crank it too low, linearity suffers; too high, noise spikes. Aim for 5-10V in Si types, monitoring with a scope. We’ve seen 15% accuracy gains from fine-tuning alone.
Then, shielding. Stray light? Kills dynamic range dead. Use baffles or enclosures—simple black anodized tubes work wonders. In one photometry bench we tuned, this alone extended usable range by 8 dB.
Don’t sleep on calibration. NIST’s transfer standards for Si EUV photodiodes emphasize traceable checks , keeping errors under 0.5%. Hit up services yearly; it’s cheaper than bad data downstream.
For software folks, log-linear plotting helps spot curves early. If your output vs. input plot bows, time for a detector swap. And hey, if you’re eyeing upgrades, peek at Bee Photon’s site—https://photo-detector.com/ has the lowdown on options that play nice with wide dynamic swings.
Oh, and a quirky bit: sometimes, stacking diodes in series boosts range without linearity loss. Pulled from old-school optics hacks, but it clicked for a fiber sensing project we consulted on—doubled their headroom for under $200 in parts.
Wrapping Up: Why Chase Better Photodiode Linearity Now?
So, there you have it—photodiode linearity isn’t some sidebar; it’s the backbone of measurement accuracy and dynamic range in your gear. Ignore it, and you’re gambling with fuzzy results that could tank projects. But get it right? Crystal-clear data, wider operating windows, and setups that hum along without babysitting.
We’ve lived this at Bee Photon, turning headaches into high-fives for teams worldwide. If your analysis instrument or power meter’s acting up on light swings, why not chat? Drop a line at info@photo-detector.com o visite nuestro página de contacto for a quick quote. Or just browse more on boosting your precision game at https://photo-detector.com/. What’s one tweak you’d try first? Let’s make your measurements bulletproof.
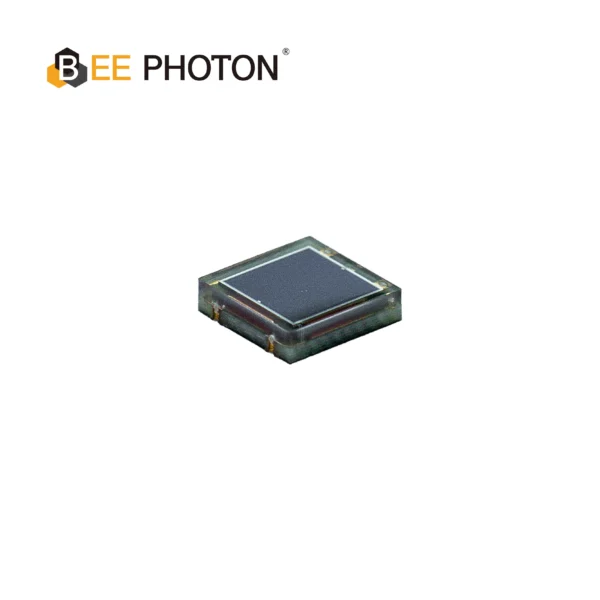
Fotodiodo PIN de Si con baja corriente oscura (350-1060nm) PDCC34-001
Bee Photon ofrece un fotodiodo PIN de Si COB compacto con una amplia respuesta espectral (350-1060 nm). Este fotodiodo Chip-on-Board presenta una baja corriente oscura, ideal para aplicaciones integradas y con limitaciones de espacio.
FAQ: Quick Hits on Photodiode Linearity and Dynamic Range
What’s the biggest culprit behind poor photodiode linearity in my power meter?
Usually, it’s overload at high lights—saturation bends the response curve. Keep inputs under 80% max rating, and you’re mostly safe. We’ve fixed tons by adding attenuators; simple win.
How do I measure dynamic range without fancy gear?
Grab a variable laser source and plot output current logarithmically. The flat stretch before noise or clip? That’s your range in dB. NIST-style traceable if you want pro-level .
Can Si PINs really handle precision photometry like IR sensing?
Absolutely—our PIN de Si para fotometría de precisión does, with <1% nonlinearity up to 1 mW/cm². Great for NIR edges without jumping to pricier InGaAs.