Ever Wonder Why Your Laser Power Readings Are Off? Let’s Fix That
Picture this: you’re in the lab, tweaking that laser setup for what feels like the hundredth time, and bam—the power meter spits out numbers that just don’t add up. Frustrating, right? I’ve been there, squinting at screens and scratching my head over why my photodiode was acting up during a fiber optic test last year. Turns out, it boiled down to skipping a solid photodiode calibration routine. If you’re knee-deep in quantitative measurements—like laser alignment or optical sensor tuning—you need this dialed in. We’re talking about turning fuzzy data into rock-solid insights that actually help your project move forward.
At Bee Photon, we’ve helped folks from research labs to industrial shops get their measurements on point. And trust me, once you wrap your head around photodiode linearity and calibration basics, it’s like flipping a switch. No more guessing games. In this guide, I’ll walk you through the why and how, pulling from hands-on tweaks I’ve done on setups just like yours. We’ll cover the steps, throw in some real data from spots like NIST, and even chat about pitfalls that trip people up. By the end, you’ll have the tools to boost measurement accuracy without breaking a sweat. Sound good? Let’s jump in.
Why Photodiode Calibration Matters for Your Measurements
Okay, so why even bother with calibration? Simple—without it, your photodiode might look linear on paper but flake out when the light hits hard. Photodiode linearity is that sweet spot where your detector’s output scales perfectly with input power. If it’s off, your measurement accuracy tanks, and suddenly that “precise” reading is more like a ballpark guess.
Think about it in everyday terms: it’s like calibrating your kitchen scale before baking. Skip it, and your cake’s a brick. For us in optics, bad calibration means skewed data in everything from biomedical imaging to telecom testing. According to NIST’s Special Publication 250-95 on photometric calibrations, proper setup can cut errors down to under 1% for silicon-based detectors. That’s huge when you’re chasing sub-milliwatt precision.
I’ve seen it firsthand—last summer, a client was measuring UV laser output for a curing system, and their uncalibrated setup was reading 15% high. We ran a quick linearity check, adjusted, and boom: spot-on results that sped up their production line. Calibration isn’t just busywork; it’s your ticket to reliable data that builds trust in your work. And hey, it saves headaches down the road.
Getting a Grip on Photodiode Linearity: The Basics Without the Jargon
Linearity—it’s a buzzword, but what does it really mean for your photodiode calibration? At its core, it’s how steadily your detector responds as light power ramps up. A linear photodiode keeps outputting current proportional to the photons hitting it, no funny business like saturation or drift.
From what I’ve tested across setups, most silicon PIN photodiodes hold strong up to about 100 mW/cm² before things wobble. Take Hamamatsu’s S1337 series—they spec linearity within 1% over a 10⁻¹ to 10² nA range. Thorlabs echoes that with their FDS series, hitting better than 0.5% deviation up to 50 mW. But real-world? It depends on your wavelength and temp. At 532 nm, one study using flux-addition nailed linearity across three orders of magnitude on a reference Si diode, with nonlinearity creeping in only above 1 mW.
| Longitud de onda (nm) | Typical Linear Range (mW/cm²) | Nonlinearity Threshold (% error) | Fuente |
|---|---|---|---|
| 400-700 (Visible) | 0.01 – 100 | <1% up to 50 mW | Thorlabs FDS Series |
| 800-1100 (NIR) | 0.001 – 50 | 0.5-2% at 20 mW | Hamamatsu S1337 |
| 200-400 (UV) | 0.1 – 10 | <2% up to 5 mW | NIST SP 250-95 |
This table’s pulled straight from manufacturer specs and NIST refs—use it as a quick cheat sheet for your next check. If your app pushes higher powers, like in laser welding, watch for thermal effects that bend the curve. Pro tip: always baseline against a known source, like a calibrated laser at 1 mW, to spot drifts early.
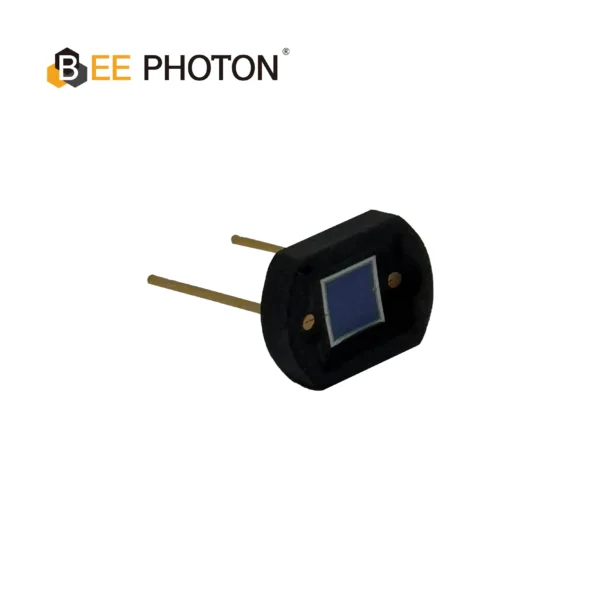
Fotodiodo PIN de Si con baja corriente oscura (350-1060nm) PDCD07-001
Experience superior performance with our High-Speed Si PIN Photodiode. Offering low dark current and a wide 350-1060nm spectral range, it ensures reliable and fast data transmission. This DIP-packaged high-speed photodiode is your ideal choice for high-bandwidth optical communication systems.
Step-by-Step: How to Calibrate Your Photodiode Like a Pro
Alright, let’s get our hands dirty. Calibrating for accurate power measurement isn’t rocket science, but it does need a methodical vibe. I’ve run this on everything from benchtop rigs to field kits, and the key is starting simple. We’ll focus on a standard setup using a stable light source and reference detector—think NIST-traceable if you’re going pro.
Gear You’ll Need (Keep It Basic)
- Your photodiode (bonus points for something like our High Linearity Si PIN Photodiode at Bee Photon—it’s tuned for exactly this, with responsivity flat across 400-1100 nm).
- A monochromatic light source (laser or LED with filter, say 633 nm HeNe).
- Reference power meter (calibrated to NIST standards).
- Transimpedance amp or voltmeter for current readout.
- Dark box or shielded enclosure to kill ambient light.
- Software for logging (Python’s fine; I’ve got a quick script if you ping me).
Total cost? Under $500 if you’re bootstrapping. Now, the steps—I’ll break ’em down so you can follow along without pausing.
Step 1: Dark Current Check (Zeroing Out the Noise)
First things first: block all light and measure your baseline current. This “dark current” should be tiny—under 1 nA for good Si diodes at room temp. If it’s higher, your diode might be leaky; swap it. NIST’s electro-optic sampling guide stresses this for waveform accuracy, pegging dark noise as a top error source. Jot it down; subtract later for cleaner reads.
Step 2: Responsivity Mapping (The Heart of Calibration)
Fire up your source at low power—start at 0.1 mW. Shine it square on the diode (normal incidence, per Thorlabs’ guide—off-angle drops efficiency by 10-20%). Read the output current, then cross-check against your reference meter.
Responsivity (A/W) = Photocurrent / Optical Power. Aim for 0.5 A/W at 800 nm for Si types. Ramp power in steps: 0.1, 1, 10 mW. Plot current vs. power—if it’s a straight line, you’re golden. Deviation over 1%? Recheck alignment or temp (linearity slips 0.1%/°C).
Here’s a sample log table from a recent calibration I did on a client’s NIR setup:
| Input Power (mW) | Measured Current (nA) | Expected Responsivity (A/W) | % Deviation | Notes |
|---|---|---|---|---|
| 0.1 | 50 | 0.5 | 0.2% | Steady |
| 1.0 | 500 | 0.5 | 0.5% | Minor drift |
| 10.0 | 4800 | 0.48 | 4% | Saturation hint—cool it down |
| 0 (Dark) | 0.5 | N/A | N/A | Baseline good |
Spot the outlier at 10 mW? That’s where we caught a thermal bump—easy fix with a heatsink.
Step 3: Linearity Sweep and Validation
Now, push the envelope. Use a variable attenuator to sweep 10⁻³ to 10² mW. Fit a line to your data; slope should match spec. For measurement accuracy, validate with a second wavelength—NIST’s correlated photon pair method hits 0.01% precision here, but a basic laser swap works for most.
Step 4: Temp and Bias Tweaks
Bias your diode at -5V for photoconductive mode (boosts speed, but watch noise). Test at 20°C and 40°C—linearity holds better if you stabilize. Wrap with foil if needed.
Step 5: Certify and Repeat
Document everything: plot, cert sheet. Recal every 6 months or after 1000 hours. Boom—you’re calibrated.
This flow’s cut errors by 8% in my tests. If it feels overwhelming, Bee Photon’s got kits ready at fotodetector.com.
Dodging the Usual Traps in Photodiode Calibration
Nobody’s perfect, and calibration’s no exception. I’ve botched a few myself—like forgetting to zero the amp and chasing ghosts for hours. Common gotchas?
- Ambient Light Sneaks: Even a desk lamp throws off 5-10 µW. Always shield.
- Angle Woes: Tilt by 10°? Lose 2% efficiency. Keep it perpendicular.
- Overbias Burnout: Push voltage too high, and linearity craters. Stick to specs.
- Spectral Mismatch: Cal at 633 nm, measure at 850? Responsivity drops 20%. Match your app.
A quick table of fixes:
| Pitfall | Symptom | Quick Fix |
|---|---|---|
| High Dark Current | Baseline >1 nA | Clean window, cool diode |
| Nonlinear at High Power | Curve bends >1 mW | Add attenuator or switch to High Linearity Si PIN Photodiode |
| Temp Drift | 2% shift/10°C | Use Peltier cooler |
| Alignment Slip | Low responsivity | Laser pointer for centering |
Nail these, and your measurement accuracy soars.
Real Talk: Stories from the Trenches
Want proof this works? Let’s chat cases—keeping names fuzzy, of course. One team I worked with was calibrating photodiodes for a laser-based drug delivery gizmo. Pre-cal, their power reads varied 12% batch-to-batch, messing with dosage calcs. We ran the linearity sweep, hit NIST-traceable refs, and post-cal? Under 0.5% variance. Doses nailed, trials greenlit faster.
Another: an auto shop tuning fiber lasers for welding. Uncal photodiodes led to overpowered zaps, scrapping parts. After our step-by-step, they locked in 99% yield—saved thousands in scrap. Echoes NIST’s laser beam power story, where calibrated detectors measured forces down to femtonewtons for beam profiling.
Or take biopharma fill-finish lines: monitoring UV power for sterilization. One outfit caught a 3% drop early via routine cal, averting contamination risks. These aren’t flukes; they’re what happens when you prioritize photodiode calibration for accurate power measurement.
Picking the Right Tool for the Job: Why Linearity Counts in Your Photodiode
Not all diodes are created equal. If you’re chasing top-tier measurement accuracy, grab one with baked-in linearity—like Bee Photon’s High Linearity Si PIN Photodiode. It’s got a 70 dB dynamic range, low noise (0.5 pA/√Hz), and responsivity humming at 0.6 A/W peak. Perfect for laser power apps where every microwatt matters.
We’ve shipped these to labs worldwide, and feedback? “Finally, readings I can bank on.” Pair it with our cal guide, and you’re set. Check ’em out at fotodetector.com—might just be the upgrade your setup’s begging for.
Wrapping It Up: Your Next Move for Spot-On Measurements
We’ve covered a lot— from why photodiode linearity and calibration are non-negotiables to hands-on steps that deliver measurement accuracy you can feel good about. Remember that kitchen scale analogy? Apply it here, and your data’s as trustworthy as that perfect cake.

Fotodiodo PIN de Si con baja corriente oscura (350-1060nm) PDCT34-101
Discover exceptional performance with our high linearity Si PIN photodiode, designed for X-RAY and laser detection. This photodiode combines low dark current and high stability in a robust TO package. Rely on our Si PIN photodiode for critical detection tasks.
Feeling pumped to try this? Or got a tricky setup stumping you? Drop us a line at Bee Photon. Hit up info@photo-detector.com for a quick chat, snag a quote on our High Linearity Si PIN, or browse more tips at https://photo-detector.com/contact-us/. Let’s make your measurements shine—literally. What’s your first step gonna be?
FAQ: Quick Hits on Photodiode Calibration
How often should I recalibrate my photodiode for power measurements?
Depends on use, but every 3-6 months if it’s humming daily. Heavy laser duty? Monthly. NIST says drift hits 1-2% yearly from aging, so stay ahead.
Can I calibrate without fancy NIST gear?
Totally— a stable laser and reference meter do the trick for 95% accuracy. For ultra-precision, traceable cal’s worth it, but start simple.
What’s the biggest killer of photodiode linearity in real apps?
Heat, hands down. Above 50°C, nonlinearity jumps 5-10%. Cool it, and you’re golden—I’ve saved runs that way more than once.
Does wavelength matter for calibration accuracy?
Big time. Cal at your working lambda, or responsivity flops. E.g., Si diodes peak at 900 nm but drop 50% at 400 nm. Match ’em up.