If you are designing high-speed automation systems or fast counting equipment, you already know that spec sheets lie. Well, maybe “lie” is a strong word, but they definately stretch the truth. You buy a sensor that claims an ultra-fast reaction, bolt it onto your production line, and suddenly your PLC is dropping counts when the conveyor belt hits maximum speed.
The culprit almost every single time? You didn’t look closely enough at the optical switch response time, specifically the nasty little difference between rise time (tr) and fall time (tf).
Most hardware engineers just look at the headline speed. They see a fast rise time and think they are good to go. But out in the real world—where dust, cable capacitance, and slightly misaligned lasers exist—that lack of attention to the full optical switch response time is going to bite you. Today, we are going to tear apart what actually happens inside these components, why your counting equipment is failing, and how to properly spec out your detectors.
The Dirty Secret of Optical Switch Response Time
Let’s get one controversial opinion out of the way right now: paying massive premiums for Avalanche Photodiodes (APDs) just to get a faster optical switch response time is usually throwing money out the window. For 90% of industrial automation, counting machines, and sorting belts, you don’t need APDs. They are noisy, require annoying high-voltage bias circuits, and drift with temperature changes.
What you actually need is a solid understanding of how standard detectors behave and how to optimize your circuit around them.
When we talk about optical switch response time, we are really talking about the time it takes for the detector to wake up, realize light has hit it, output a useful signal, and then—crucially—go back to sleep when the light stops.
Breaking Down Rise Time (tr)
Rise time (often written as tr) is the time it takes for your sensor’s output signal to jump from 10% to 90% of its maximum peak value after the light hits it. Think of it as the reaction time of a sprinter leaving the starting blocks.
In a perfect enviroment, your optical switch response time would be entirely dictated by the transit time of the carriers (electrons and holes) moving across the depletion region of the diode. The formula for this transit-time limited rise time is fairly simple to punch into your calculator:
tr = 0.35 / BW
(Where BW is the bandwidth of your system).
The Real Enemy: Fall Time (tf)
Here is where the marketing fluff falls apart. Manufacturers love bragging about tr. But they often hide the fall time (tf), which is the time it takes for the signal to drop from 90% back down to 10% when the light is removed.
Why do they hide it? Because fall time is almost always slower than rise time.
When light hits a photodiode, it creates electron-hole pairs. Electrons are fast. They zip across the depletion region quickly. Holes, on the other hand, are sluggish. They drag their feet. Furthermore, if your light penetrates outside the depletion region into the undepleted bulk silicon, the carriers generated there have to slowly diffuse back. This “diffusion tail” completely ruins your optical switch response time. You might have a rise time of 1 nanosecond, but a fall time of 15 nanoseconds. If your counting equipment is looking for clean, square pulses, that long tail is going to cause your system to register two fast objects as one single, long object.
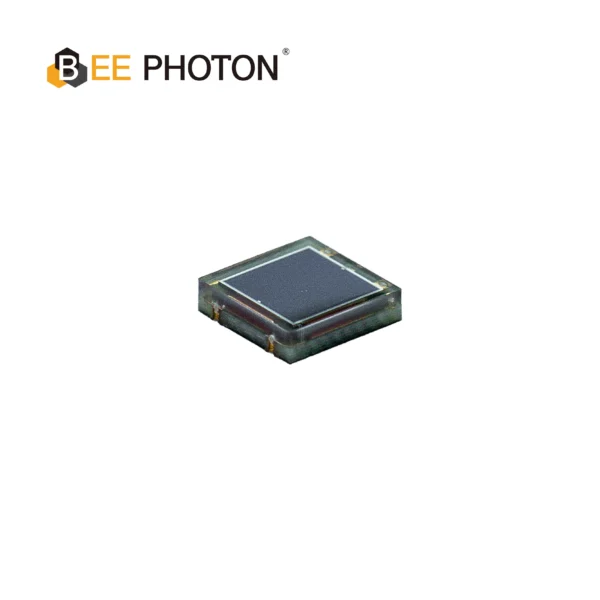
Si PIN Photodiode with low dark current (350-1060nm) PDCC34-001
Bee Photon offers a compact COB Si PIN Photodiode with wide spectral response (350-1060nm). This Chip-on-Board photodiode features low dark current, ideal for integrated and space-constrained applications.
Why Your Counting Equipment is Dropping Packages
Let’s put this into a real-world scenario. You are building a high-speed pharmaceutical pill counter. The pills are dropping past your sensor at a terrifying rate.
If your overall optical switch response time is too slow, the signal won’t have enough time to return to zero before the next pill blocks the light. The signals bleed into each other. Your PLC sees a constant “ON” state instead of individual pulses.
To evaluate if your device speed meets the frequency requirements of your automation equipment, you can’t just guess. You need to calculate the absolute maximum frequency your sensor can handle based on its optical switch response time.
The f_max Formula You Actually Need
Forget the complicated physics for a second. If you want a quick and dirty way to know if your optical switch response time is fast enough for your machine, use this text-friendly formula:
f_max = 1 / (2 * (tr + tf))
Let’s say your sensor has a rise time (tr) of 5 microseconds and a fall time (tf) of 10 microseconds.
Your total transition time is 15 microseconds.
Multiply by 2, you get 30 microseconds.
1 divided by 30 microseconds gives you a maximum frequency of roughly 33.3 kHz.
If your machine needs to count objects passing at 50 kHz, your current optical switch response time is going to fail miserably. You will get double-counts, miscounts, and ultimately, a very angry client wondering why their inventory numbers are totally messed up.
Si PIN Photodiodes: The Sweet Spot for Optical Switch Response Time
Remember how I said earlier that APDs are overrated for most automation tasks? This is where PIN diodes step in.
A PIN photodiode adds an intrinsic (I) layer between the P and N layers. This makes the depletion region wider. A wider depletion region means less capacitance. And as any first-year engineering student knows, lower capacitance means a drastically improved optical switch response time.
Because the depletion region is thicker, most of the light is absorbed right there, meaning you get fast drift current and very little of that slow, annoying diffusion current we talked about earlier. This makes the fall time nearly as fast as the rise time, giving you a beautiful, clean square wave that your counting equipment will love.
If you are looking to upgrade your sorting line’s speed without dealing with the headache of APD high-voltage requirements, swapping to high-speed Si PIN photodiodes is basically the ultimate cheat code. They give you the optical switch response time you need at a fraction of the complexity.
Key Factors Messing Up Your Optical Switch Response Time
Even if you buy the best Si PIN diode on the market, you can still ruin your optical switch response time if you don’t design your circuit right. The diode doesn’t operate in a vacuum.
The R-C Time Constant Trap
Your optical switch response time is heavily restricted by the RC time constant of your circuit. This includes the junction capacitance of the diode itself, the stray capacitance of your PCB traces, the capacitance of the cables, and your load resistance.
The formula for the RC limited rise time is:
tr = 2.2 * R_load * C_total
Let’s look at the math. If you want a larger voltage swing to make it easier for your PLC to read, you might be tempted to use a massive load resistor (R_load). But look at the formula! If you increase R_load, your optical switch response time goes up (meaning it gets slower). You are trading speed for signal amplitude.
If your cable is 5 meters long and adds 100 picofarads of capacitance, and you use a 10k ohm resistor, your optical switch response time is going to be sluggish, no matter how fast the diode itself is. You have to keep your traces short, use low-capacitance cables, and balance your load resistor carefully.
Reverse Bias Voltage
Want to artificially lower the capacitance of your diode and improve your optical switch response time? Apply a reverse bias voltage. Pushing a reverse voltage across a PIN diode widens the depletion region even further. This drops the junction capacitance and sweeps the carriers out faster.
Just make sure you check the datasheet for the maximum reverse voltage, or you’ll fry the component.

Si PIN Photodiode with low dark current (350-1060nm) PDCC14-001
Our Si PIN for precision photometry delivers exceptional accuracy for sensitive light measurement. With low dark current, this photodiode is ideal for analytical and scientific instruments requiring precise results.
Real-World Data: Benchmarking Detectors
I know engineers love hard data, so let’s look at how different technologies stack up when we measure their optical switch response time. The data below reflects typical industry benchmarks for detectors used in high-speed B2B automation. According to tests verified by standard IEEE electro-optical principles, the difference in optical switch response time across architectures is staggering.
| Detector Type | Typical Rise Time (tr) | Typical Fall Time (tf) | Optical Switch Response Time Suitability | Best Use Case in Automation |
|---|---|---|---|---|
| Standard PN Photodiode | 1 – 5 µs | 5 – 20 µs | Slow to Moderate | Basic object presence detection, slow conveyors. |
| Phototransistor | 5 – 15 µs | 10 – 50 µs | Very Slow | Human-interface switches, low-speed gates. |
| Si PIN Photodiode | 0.1 – 1 ns | 0.1 – 2 ns | Ultra-Fast | High-speed counting, rapid sorting, laser alignment. |
| Avalanche Photodiode (APD) | 0.1 – 0.5 ns | 0.1 – 0.5 ns | Extreme (but noisy) | Fiber optic communications, long-range LiDAR. |
As you can see, phototransistors are terrible if you care about optical switch response time. They have huge internal gain, but that gain comes at the cost of massive capacitance. If your counting equipment is running fast and you are using a phototransistor, you are going to have a bad time. Stick to Si PIN diodes.
Success Story: Fixing a High-Speed Sorter Bottleneck
I want to share an anonymous story from a B2B client we worked with recently. They manufacture high-speed optical sorting machines used in the agriculture industry to sort bad grains of rice from good ones as they fall through mid-air.
They were using standard PN photodiodes. Their system worked fine at 500 kilograms per hour. But when they tried to crank the machine up to 800 kg/hr, the sorting accuracy dropped from 99% to 82%.
They blamed their software algorithms. They spent months rewriting PLC logic. They thought the air ejectors were lagging.
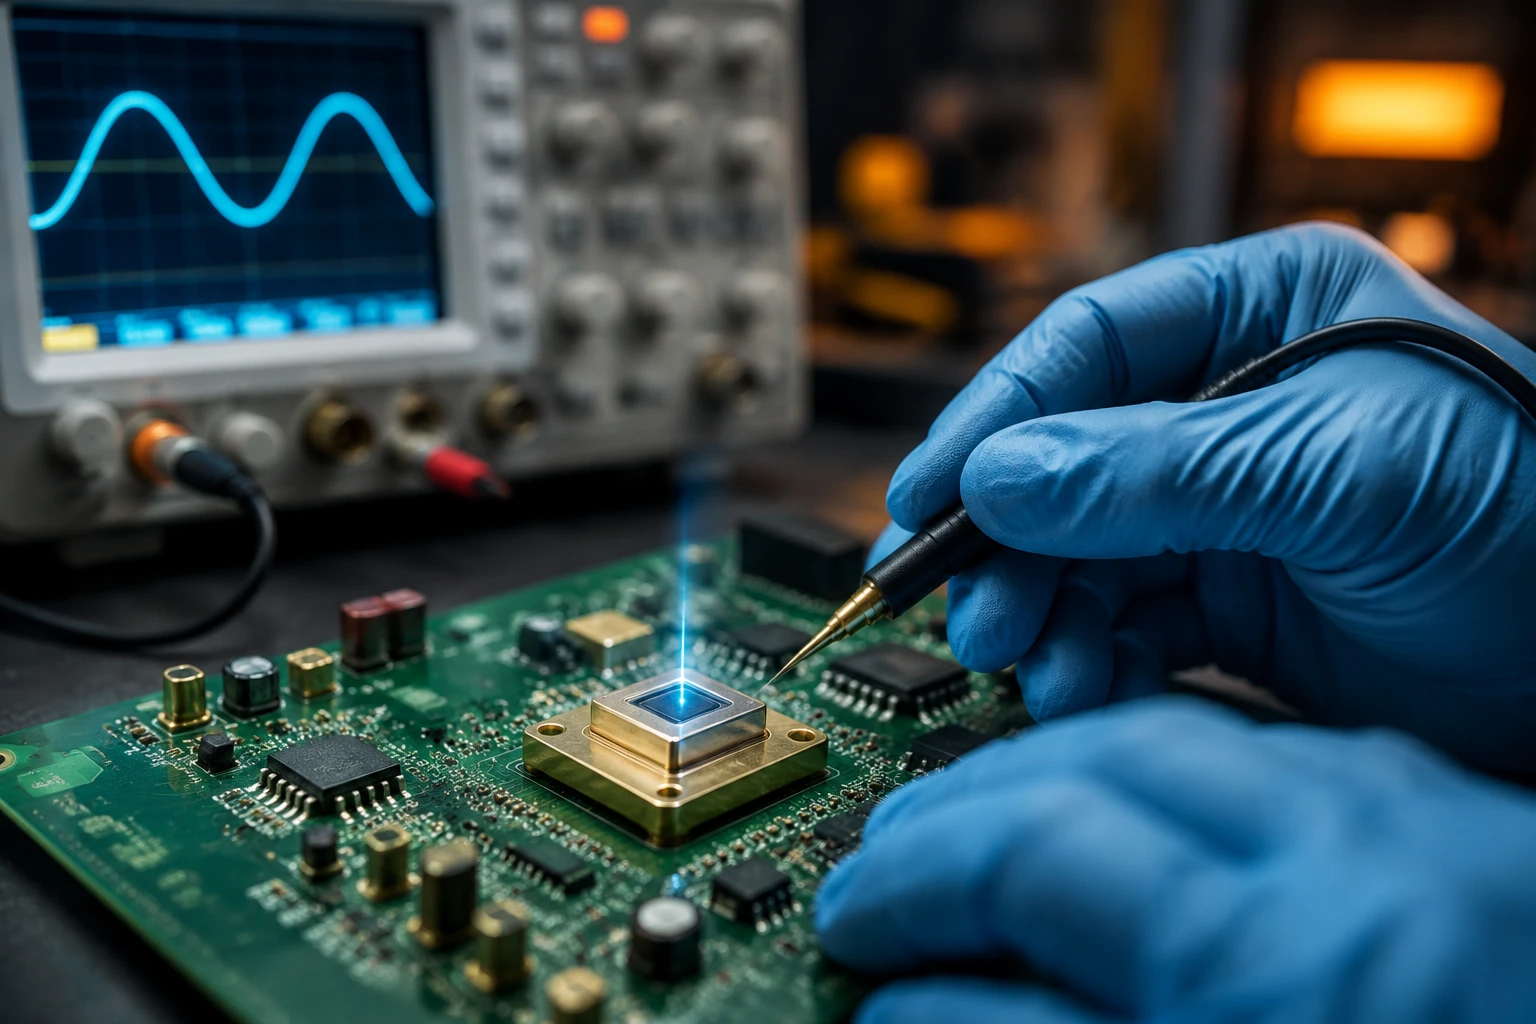
They eventually reached out to us to review the hardware. We hooked an oscilloscope up to their sensor board and immediately saw the problem. Their optical switch response time was completely inadequate. The rise time was acceptable, but the fall time was a massive, sloping mess due to carrier diffusion in the cheap PN diodes they were using. The grains of rice were falling so fast that the sensor’s signal never returned to the baseline. The machine literally couldn’t “see” the gap between two grains.
We swapped their cheap sensors out for custom Si PIN photodiodes. We also lowered their load resistor from 5k ohms to 50 ohms and added a transimpedance amplifier (TIA) to recover the lost signal amplitude without sacrificing speed.
The result? The optical switch response time dropped from microseconds into the low nanosecond range. The machine comfortably hit 1,000 kg/hr with 99.5% accuracy. It wasn’t a software problem; it was pure physics.
How to Test Your Optical Switch Response Time Without Fooling Yourself
If you are going to test your own optical switch response time in the lab, please do not use a standard LED driven by a cheap signal generator. Most LEDs have a horribly slow turn-off time due to their own carrier lifetimes.
If you use a slow LED to test a fast photodiode, you aren’t measuring the optical switch response time of the diode—you are measuring the optical switch response time of the LED!
To get real numbers:
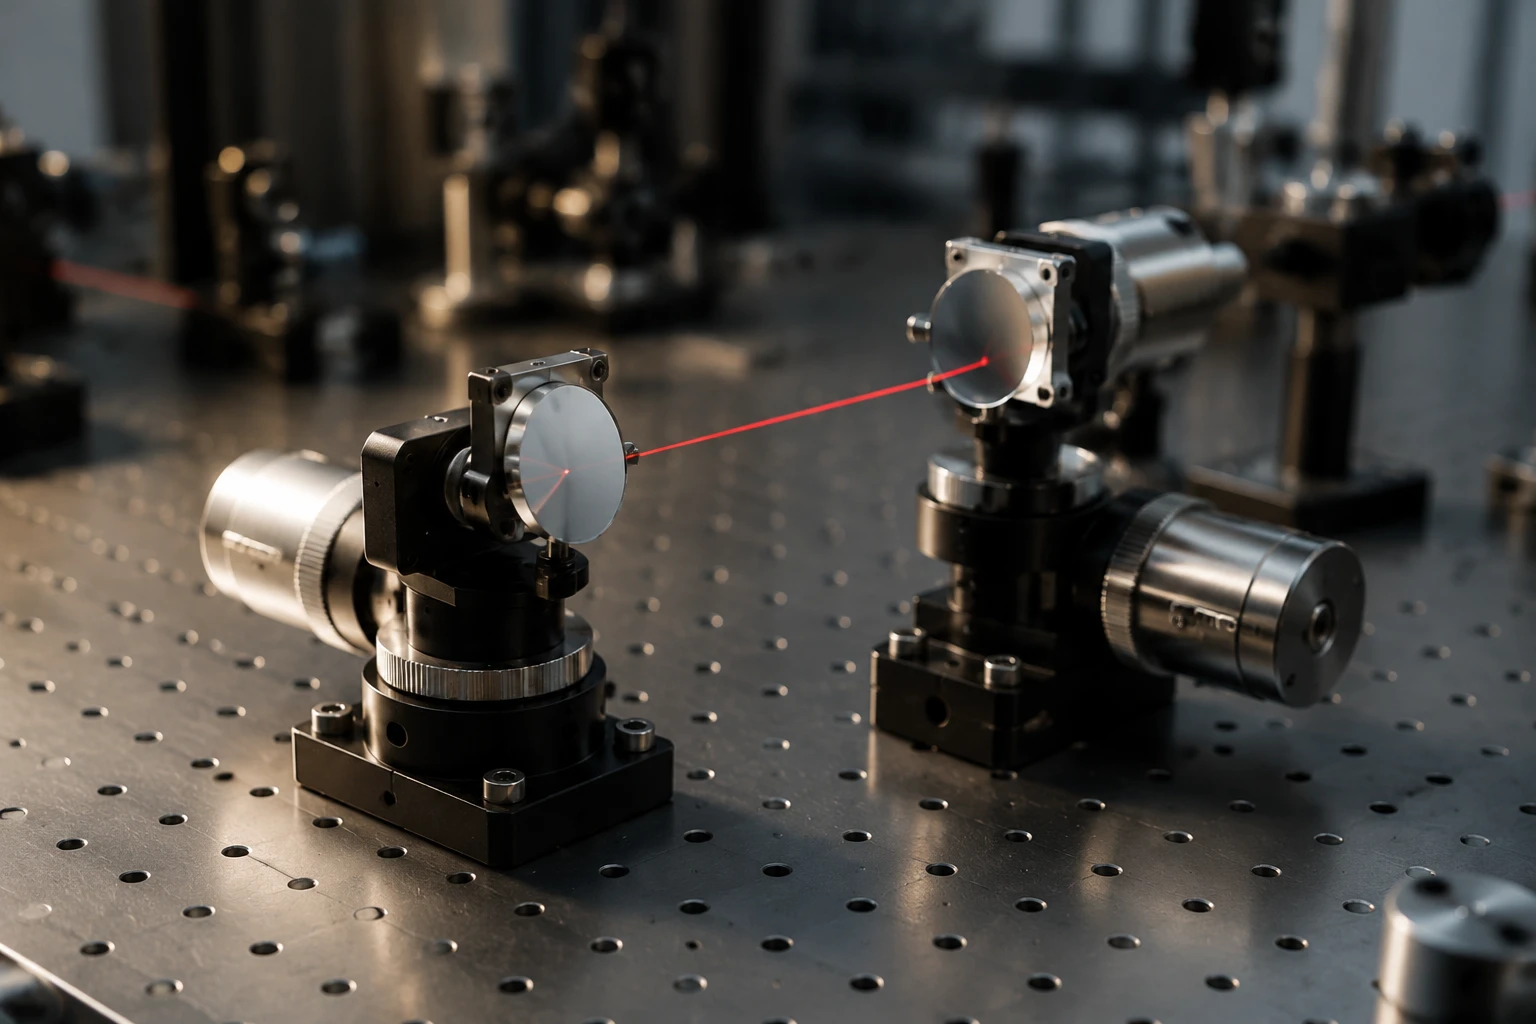
- Use a fast pulsed laser diode with a driver capable of sub-nanosecond rise/fall times.
- Ensure your oscilloscope has a bandwidth at least 3 to 5 times higher than the frequency you are trying to measure.
- Terminate your BNC cables properly (usually into 50 ohms) to prevent signal reflections that look like fake “ringing” in your fall time.
Getting accurate data on your optical switch response time is the only way to guarantee your automation equipment won’t fall apart in the field.

Si PIN Photodiode with low dark current (350-1060nm) PDCT34-101
Discover exceptional performance with our high linearity Si PIN photodiode, designed for X-RAY and laser detection. This photodiode combines low dark current and high stability in a robust TO package. Rely on our Si PIN photodiode for critical detection tasks.
FAQ: Your Optical Switch Response Time Questions Answered
Q: Why does my optical switch response time get worse when the temperature increases?
A: Heat increases the thermal energy of the lattice in the silicon, which actually decreases carrier mobility. Slower carriers mean a longer transit time. Plus, higher temps increase dark current, which adds noise to your signal baseline, making it harder for your system to definitively trigger on the rise or fall time.
Q: Can I just fix a slow optical switch response time in software with debouncing?
A: No. Software debouncing is for mechanical switch bounce. If your optical switch response time is fundamentally slower than the physical event happening in front of it (like two fast-moving objects), the data is destroyed at the physics level. Software cannot reconstruct a gap between objects that the sensor never detected.
Q: Are there trade-offs to applying a high reverse bias voltage to improve speed?
A: Definately. While increasing the reverse bias improves your optical switch response time by lowering capacitance, it also increases the dark current (leakage current) of the diode. This increases shot noise. You have to find the balance where the diode is fast enough, but the noise floor doesn’t swamp your signal.
Q: How do I know if my counting equipment needs a faster response time?
A: If your machine counts perfectly at slow speeds but starts missing counts or freezing up at high speeds—and you’ve ruled out mechanical jams—your optical switch response time is likely the bottleneck. You need to calculate the time between passing objects and ensure your tr + tf is significantly smaller than that gap.
Stop Guessing, Start Measuring
Let’s be real. If you are reading this, you are probably dealing with a system that isn’t performing the way you want it to. You’re tired of sorting lines jamming, counting equipment dropping numbers, and the endless debugging loops.
We’ve just walked through exactly how load resistors, capacitance, and basic physics dictate your optical switch response time. You know that relying on generic spec sheets is a recipe for disaster, and that fall time (tf) is the silent killer of high-speed automation.
Imagine your sorting machines running flawlessly at maximum frequency, with crisp, square-wave signals that your PLC never misinterprets. No more software bandaids. No more double-counts. Just pure, reliable hardware performance.
You don’t have to figure this out alone. If you need to upgrade your counting equipment’s speed, explore BeePhoton’s optical switch solutions to find the exact components built for your frequency requirements. Better yet, stop wasting time tweaking bad circuits and reach out to our engineering team directly. We can help you spec the perfect Si PIN photodiode and dial in your optical switch response time for maximum efficiency. Send us your parameters, and let’s get your automation running the way it was designed to.